18 min to read
Complete Guide to Functional Tests
Why functional tests might be the most valuable thing in your codebase

The AI era shifts testing priorities
In today’s world when AI agents might produce huge amounts of code good tests are getting more important than ever. Without them we can’t really progress fast, as checking if everything is fine will become our new bottleneck.
In traditional types of tests, we are usually verifying units of code - in isolation or in integration with each other.
But here’s the problem: those types of tests are tightly coupled to implementation. When an AI rewrites a method, changes a signature, or reshuffles internal logic, your tests may break. And as of course AI can change your tests as well, you will end up in the same place - verifying if behavior you are testing is still valid.
What should remain stable across all those rewrites? Business scenarios and contracts. “When a user places an order with insufficient inventory, the order should be rejected.”
That doesn’t change no matter how many times the internals get refactored. Such tests verify exactly this — the database query still returns the right data, the Kafka message still gets published, the API still responds correctly — regardless of how the internals were reshuffled. For sake of this post I will call them: functional tests — tests that verify business function, not code structure.
This makes functional tests a much more durable investment in an AI-assisted workflow. They act as guardrails that let you confidently accept AI-generated changes. If the functional tests pass, the system still behaves correctly. The implementation details? Those are just an implementation detail.

Functional tests as living documentation
There is another benefit worth mentioning — those tests also become documentation. They describe why something exists and how it should behave — not in terms of method calls and mock setups, but in terms of business intent.
A well named test tells you quite a bit about behaviors in your system:
[Test]
[Story("PROJ-4521")]
[Description("Orders with insufficient inventory should be rejected with appropriate error")]
public async Task Should_RejectOrder_When_InventoryIsInsufficient()
And unlike traditional documentations, it doesn’t get stale as easily — it runs on every build, and it screams when the described behavior breaks.
Functional tests linked with bug or feature story allow anyone to take a look at and understand exactly what scenario it covers and why it was added. You get a traceable history of business decisions, encoded in executable code.
A debugging superpower
They’re also surprisingly useful for debugging. Modern services rarely live in isolation. Your application talks to a database, publishes to Kafka, stores files in Blob Storage, calls external APIs — the list goes on. And when something goes wrong, you need to debug it.
The traditional approach? Start docker-compose, attach a debugger, make sure connection strings are configured, then dig through your .http files or Postman collections to craft the right request. By the time you’ve reproduced the issue, you’ve lost half your morning.
With a well-structured functional test, all of this collapses into a single action: click Run on a test. The test spins up the infrastructure, seeds the necessary data, executes the exact scenario you care about — and you can place a breakpoint anywhere in the actual service code. No Postman, no manual setup.

QA and dev, side by side
The QA role is shifting as well. More and more teams expect QA engineers to write automated tests and be part of the creation process rather than rely purely on manual testing. But where do those tests live? Often in a separate repository, a separate framework, sometimes even a separate language — creating a gap between development and QA that’s hard to bridge.
With a solid functional test project in the main repository, that gap disappears. QA engineers work alongside developers — same codebase, same pull requests, same CI pipeline.
This removes the handoff wall. QA doesn’t wait for a deployed environment to start testing. Developers get immediate feedback from QA-authored scenarios. And everyone shares ownership of quality.

Dogfooding your own API
Working this way has one more side effect — you end up using your own API same way as you are serving it to your clients. You experience the same friction your clients will — clunky request models, confusing error responses, missing validation, inconsistent naming.
You discover these problems immediately, not after someone else complains.
The test code itself becomes a practical usage example: how to authenticate, how to construct a request, what to expect in response. This can serve as a guide for other teams or external consumers — real, working code is always more trustworthy than hand-written API documentation.
Why TUnit
For the examples in this post, I’ll be using TUnit — a relatively new testing framework for .NET. If you’ve been using xUnit or NUnit for years, you might wonder why bother switching.
The biggest difference is architectural: TUnit uses source generation instead of runtime reflection to discover tests. Tests are resolved at compile time, which makes discovery faster and enables things like Native AOT compilation — something xUnit and NUnit can’t do today.
A few things that make it a good fit for functional testing specifically:
- Parallel by default — all tests run in parallel, even within the same class. That’s important is it does reflects real world usage and allows to quickly discover many problems.
- Simple API — one
[Test]attribute for everything. No[Fact]vs[Theory]distinction, no cognitive overhead. - Clean lifecycle hooks —
[Before(Test)],[After(Class)],[Before(Assembly)]etc. No more jugglingIAsyncLifetimeand constructor injection for async setup. - Shared infrastructure via
ClassDataSource— this one is particularly useful for functional tests. You can inject expensive resources like Docker containers or networks into test classes and control their lifetime withSharedType.
Testcontainers — real infrastructure in tests
So we have a testing framework. But functional tests need actual infrastructure — a database, a message broker, blob storage. You can’t fake those with in-memory substitutes and expect realistic results.
Testcontainers solves this by providing easy abstraction over provisioning containers. When tests finish, containers are destroyed. Clean slate every time.
The library provides a fluent API for configuring containers. Here’s a PostgreSQL example using TUnit’s ClassDataSource:
public class PostgresFixture : IAsyncInitializer, IAsyncDisposable
{
    private readonly PostgreSqlContainer _container = new PostgreSqlBuilder("postgres:17").Build();

    public string ConnectionString => _container.GetConnectionString();

    public async Task InitializeAsync() => await _container.StartAsync();

    public async ValueTask DisposeAsync() => await _container.DisposeAsync();
}
With the ClassDataSource<PostgresContainer>(Shared = SharedType.PerTestSession) attribute we saw earlier, this container starts once for the entire test run. Every test class that needs Postgres just declares the property — no manual wiring, TUnit deals with automatic dependency resolution.
Now we need to tie it all together. A ApiFixture that owns all the infrastructure, builds an application with the real connection strings, and exposes an HttpClient ready to go:
public class ApiFixture : IAsyncInitializer, IAsyncDisposable
{
    [ClassDataSource<PostgresqlFixture>(Shared = SharedType.PerTestSession)]
    public required PostgresqlFixture Postgresql { get; init; }

    [ClassDataSource<WireMockFixture>(Shared = SharedType.PerTestSession)]
    public required WireMockFixture Wiremock { get; init; }

    public HttpClient Client { get; private set; } = null!;

    public async Task InitializeAsync()
    {
        var app = new Application(Postgresql.ConnectionString, Wiremock.Url);

        Client = app.CreateClient();
    }
}
A test class just needs the fixture:
public class OrderTests
{
    [ClassDataSource<ApiFixture>(Shared = SharedType.PerTestSession)]
    public required ApiFixture App {get; init;}

    [Test]
    public async Task Should_RejectOrder_When_InventoryIsInsufficient()
    {
        var order = new CreateOrderRequest("SKU-001", Quantity: 100);

        var response = await App.Client.PostAsJsonAsync("/api/orders", order);

        await Assert.That(response.StatusCode).IsEqualTo(HttpStatusCode.OK);
    }
}
Infrastructure starts once, the application boots with real dependencies, and each test is just a scenario.
The parallel context trap
But there is a catch when running tests in parallel. Because we share a single instance of WireMock and Kafka across all concurrent tests, the context becomes messy. If Test A and Test B both expect WireMock to return a specific response, or both publish a message to the same Kafka topic at the exact same time, they will step on each other’s toes. Test A might accidentally consume Test B’s message, or WireMock might return Test B’s mock to Test A.
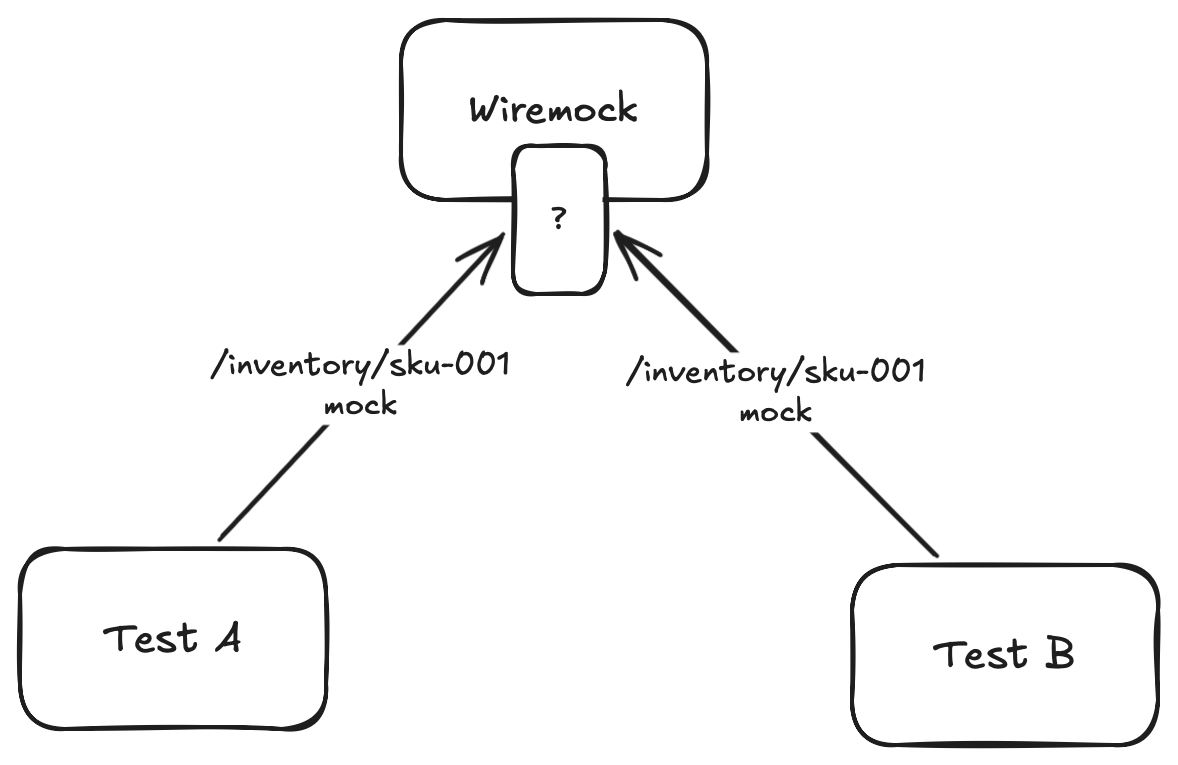
Without careful isolation, our tests will become flaky. To solve this, we need a way to pass a unique context from our test and implement distribution of it all the way downstream.
Keeping context with OpenTelemetry
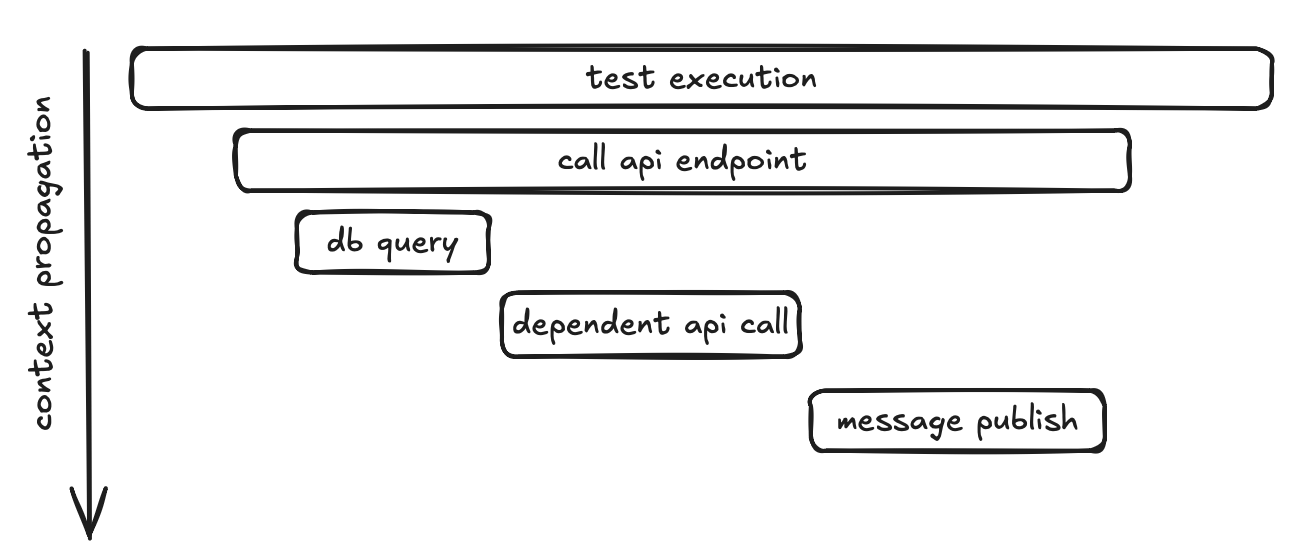
The solution is surprisingly elegant if you’re already using OpenTelemetry — and you probably should be. The idea: give each test its own trace, and let standard W3C trace propagation do the isolation for you.
If we start an Activity before each test, every request that test makes will carry a unique traceparent header — and that header flows all the way through to the WebApi to any outbound calls (WireMock, Kafka, etc.).
If you want to dive deeper into how context propagation works in distributed systems and how OpenTelemetry handles it under the hood, I wrote a dedicated post about it: Context propagation in distributed systems and cooperation with OpenTelemetry.
One activity per test
TUnit’s lifecycle hooks make this trivial:
private static readonly ActivitySource TestActivitySource = new("FunctionalTestsSource");

[Before(TestSession)]
public static void BeforeTestSession()
{
    _tracingBuilder = Sdk.CreateTracerProviderBuilder()
        .ConfigureResource(r => r.AddService("functional-tests"))
        .AddHttpClientInstrumentation()
        .AddSource(TestActivitySource.Name);

    _activityListener = new ActivityListener
    {
        ShouldListenTo = _ => true,
        Sample = (ref _) => ActivitySamplingResult.AllDataAndRecorded
    };

    ActivitySource.AddActivityListener(_activityListener);
}

[BeforeEvery(Test)]
public static void BeforeEveryTest()
{
    _ = TestActivitySource.StartActivity(TestContext.Current!.Metadata.TestName);
    TestContext.Current.AddAsyncLocalValues(); //ensures the activity flows correctly across async boundaries within TUnit's execution model
}
Before the entire test session starts, we set up an OpenTelemetry tracer provider and register an ActivityListener that samples everything — this ensures all activities created during the run are actually recorded. The AddHttpClientInstrumentation() call makes sure that every outbound HTTP request automatically carries the trace context forward.
You can easily add other instrumentations here as well — for example, if your tests publish messages to Kafka, adding the corresponding messaging instrumentation will propagate context onto those messages too
Then, before every individual test, we start a new Activity named after the test. From that point on, any call made within that test inherits this activity’s trace context.
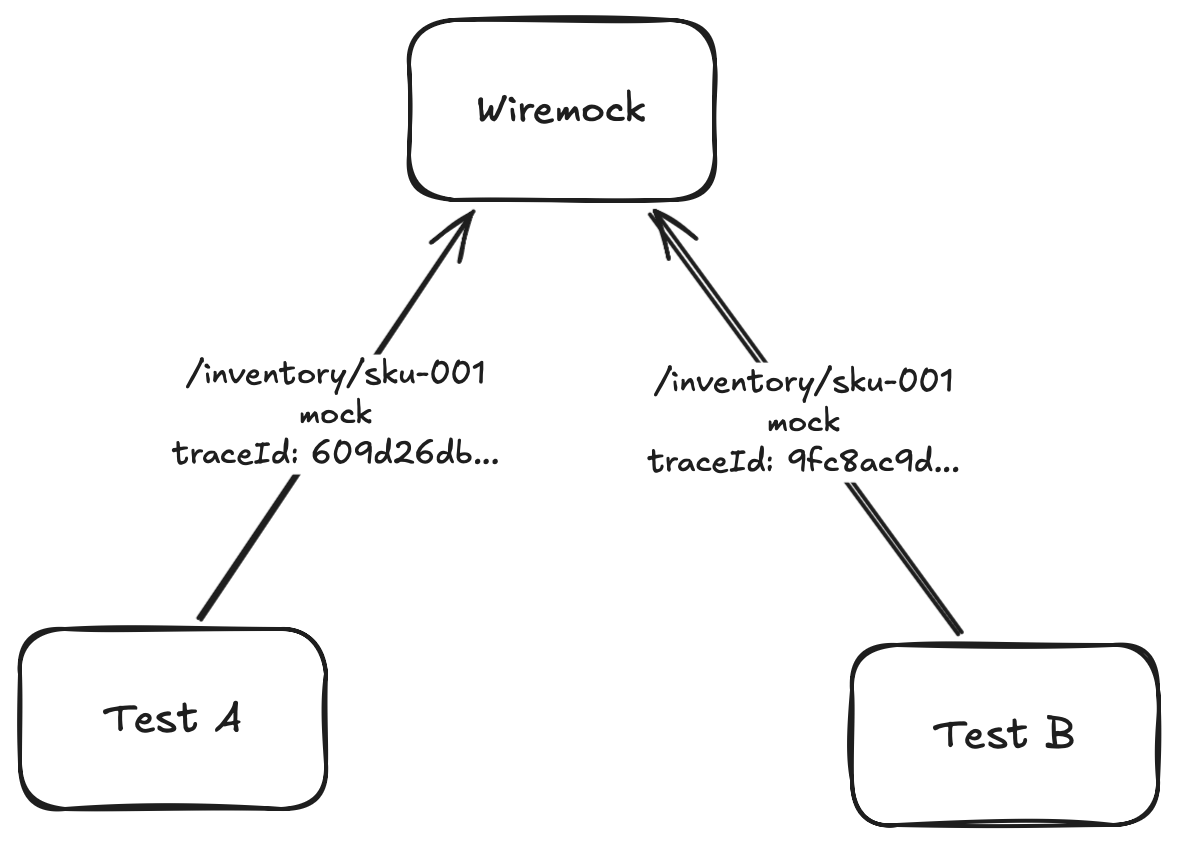
Scoping WireMock stubs to a trace
Here’s where it pays off. When we register a WireMock stub, we can add a header matcher that requires the traceparent to contain our test’s trace ID:
new MatcherModel()
{
    Name = "WildcardMatcher",
    Pattern = $"*{Activity.Current.TraceId}*"
}
Now when Test A and Test B both set up a stub for /inventory/SKU-001, they don’t collide. Test A’s stub only matches requests carrying Test A’s trace ID, and vice versa. The traceparent header acts as a natural isolation key — and we didn’t have to invent any custom correlation mechanism.
What’s important — this works when API propagates trace context on its outbound HTTP calls (that’s what AddHttpClientInstrumentation() does). We’re just piggybacking on standard OpenTelemetry behavior.
Marking test results on the trace
Since we already have an Activity per test, we can also record the test outcome on it. This becomes very useful when we add observability tooling later:
[AfterEvery(Test)]
public static void AfterEveryTest()
{
    var currentContext = TestContext.Current!;
    var currentActivity = Activity.Current;

    var activityStatus = currentContext.Execution.Result?.State switch
    {
        TestState.Passed => ActivityStatusCode.Ok,
        TestState.Failed => ActivityStatusCode.Error,
        TestState.Skipped => ActivityStatusCode.Unset,
        _ => ActivityStatusCode.Unset
    };

    if (currentContext.Execution.Result?.OriginalException is { } originalException)
    {
        currentActivity.AddException(originalException);
    }
    else if (currentContext.Execution.Result?.Exception is { } exception)
    {
        currentActivity.AddException(exception);
    }

    Activity.Current?.Dispose();
}
Every test now carries its pass/fail status and any exception as part of its trace. When a test fails, you won’t just see “assertion failed” — you’ll see the full trace of what happened, including every HTTP call the API made, every database query, every Kafka publish. But we need somewhere to actually see those traces — which brings us to Aspire.
Observability with Aspire
![]()
We’ve been collecting traces this whole time — every test gets its own Activity, every HTTP call carries traceparent, pass/fail status is recorded on spans. But so far we’re only using it for test isolation. It would be a shame not to actually look at all that telemetry we’re already collecting.
The .NET Aspire Dashboard is a lightweight OTLP receiver and viewer — distributed traces, structured logs, and metrics — all in a single UI. And since we’re already running everything in Docker, we can treat it as just another Testcontainer.
Aspire Dashboard as a Testcontainer
public class AspireDashboardFixture : IAsyncInitializer, IAsyncDisposable
{
    private const int DashboardPort = 18888;
    private const int OtlpGrpcPort = 18889;
    private IContainer _container = null!;

    public async Task InitializeAsync()
    {
        _container = new ContainerBuilder("mcr.microsoft.com/dotnet/aspire-dashboard:latest")
            .WithNetworkAliases("aspire_dashboard")
            .WithPortBinding(DashboardPort, true)
            .WithPortBinding(OtlpGrpcPort, true)
            .Build();

        await _container.StartAsync();
    }

    // ...
}
The dashboard exposes two ports — 18888 for the web UI and 18889 for the OTLP gRPC endpoint that receives telemetry. Once the container is up, we finalize our tracer provider by pointing its OTLP exporter at the dashboard:
public static void SetupOtlpExporter(string address)
{
    _tracerProvider = _tracingBuilder.AddOtlpExporter(opt =>
    {
        opt.Endpoint = new Uri(address);
        opt.Protocol = OpenTelemetry.Exporter.OtlpExportProtocol.Grpc;
    }).Build();
}
From this point on, every Activity created in our tests — the per-test spans, the HTTP calls, pass/fail statuses — all gets exported to the Aspire Dashboard.
Wiring the API to the same dashboard
Our test process now exports traces to Aspire. But we also want the API under test to send its telemetry to the same place — so we get the full picture, not just the test side.
Since our API already has OpenTelemetry configured with AddOtlpExporter that reads from configuration, it picks this up automatically. No code changes in the API itself — just environment variables.
What you get
Open http://localhost:{dashboard-port} (dashboard-port is one randomly exposed by testcontainers) and the payoff becomes obvious. For each test you see a full distributed trace — the test’s root span at the top, followed by the HTTP request to the API, the API’s inbound handling, its outbound call to WireMock for inventory check, the Postgres insert, the Kafka publish. All in a single waterfall view.
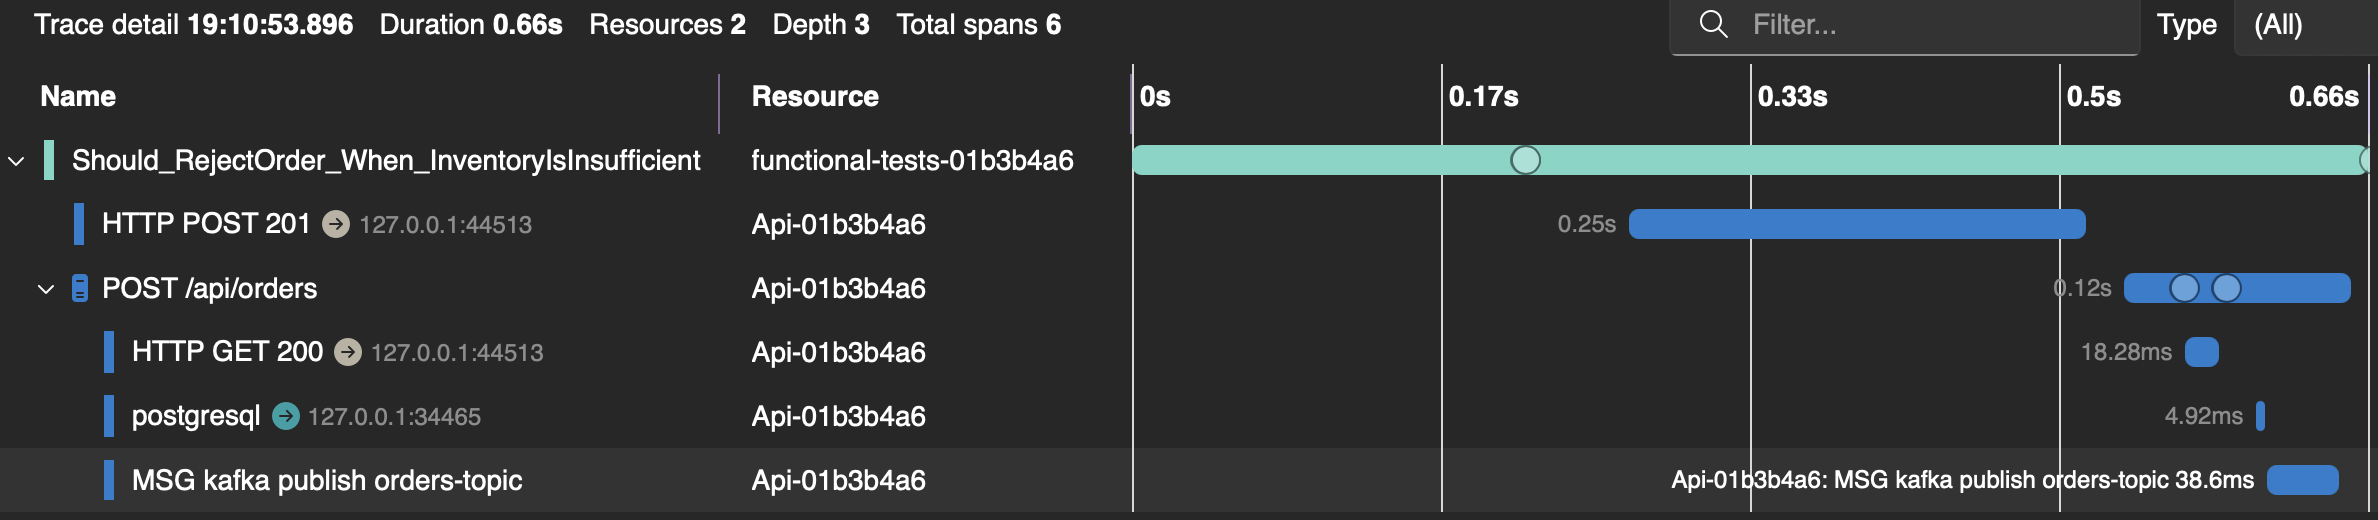
When a test fails, you don’t just get “assertion failed” in your test output. You open the trace and see exactly where things went wrong — maybe WireMock returned an unexpected response, maybe the database query threw, maybe Kafka timed out. The exception is right there on the span, alongside structured logs from the API.
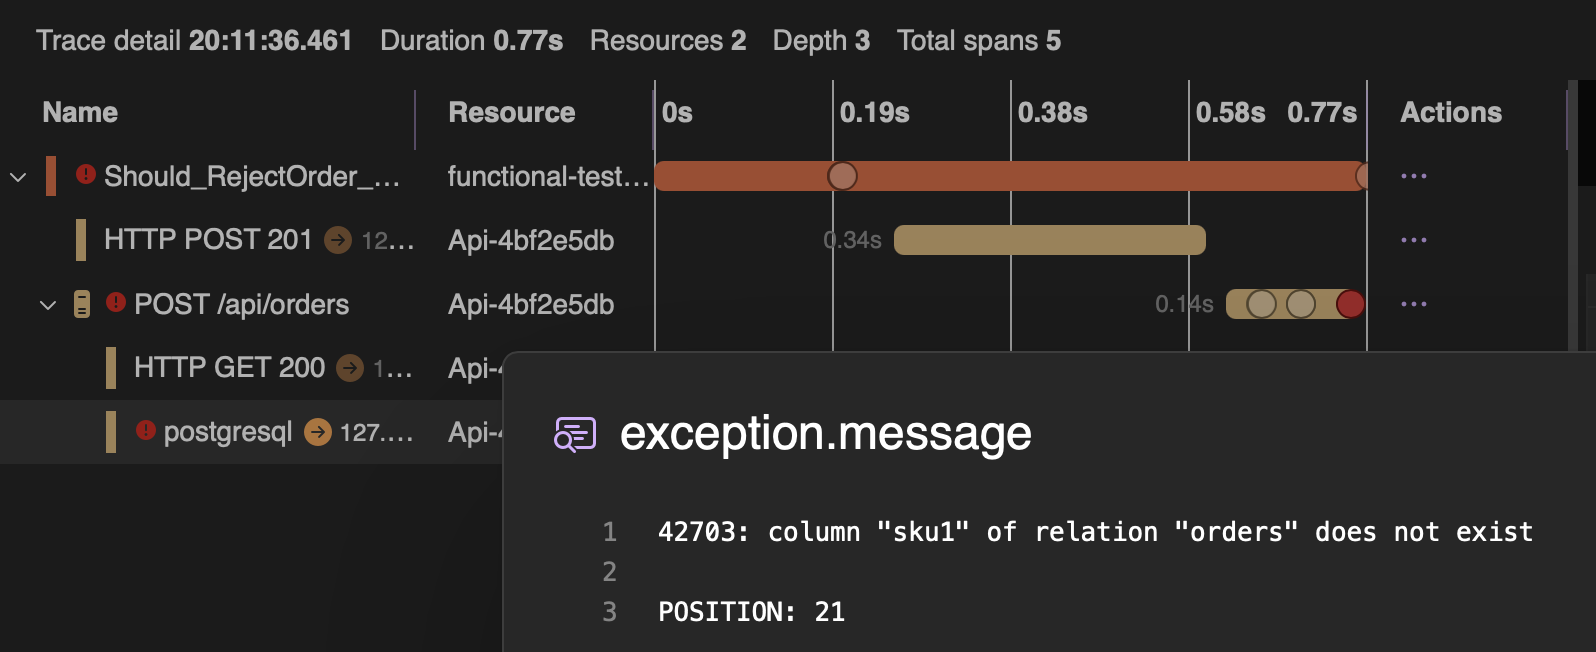
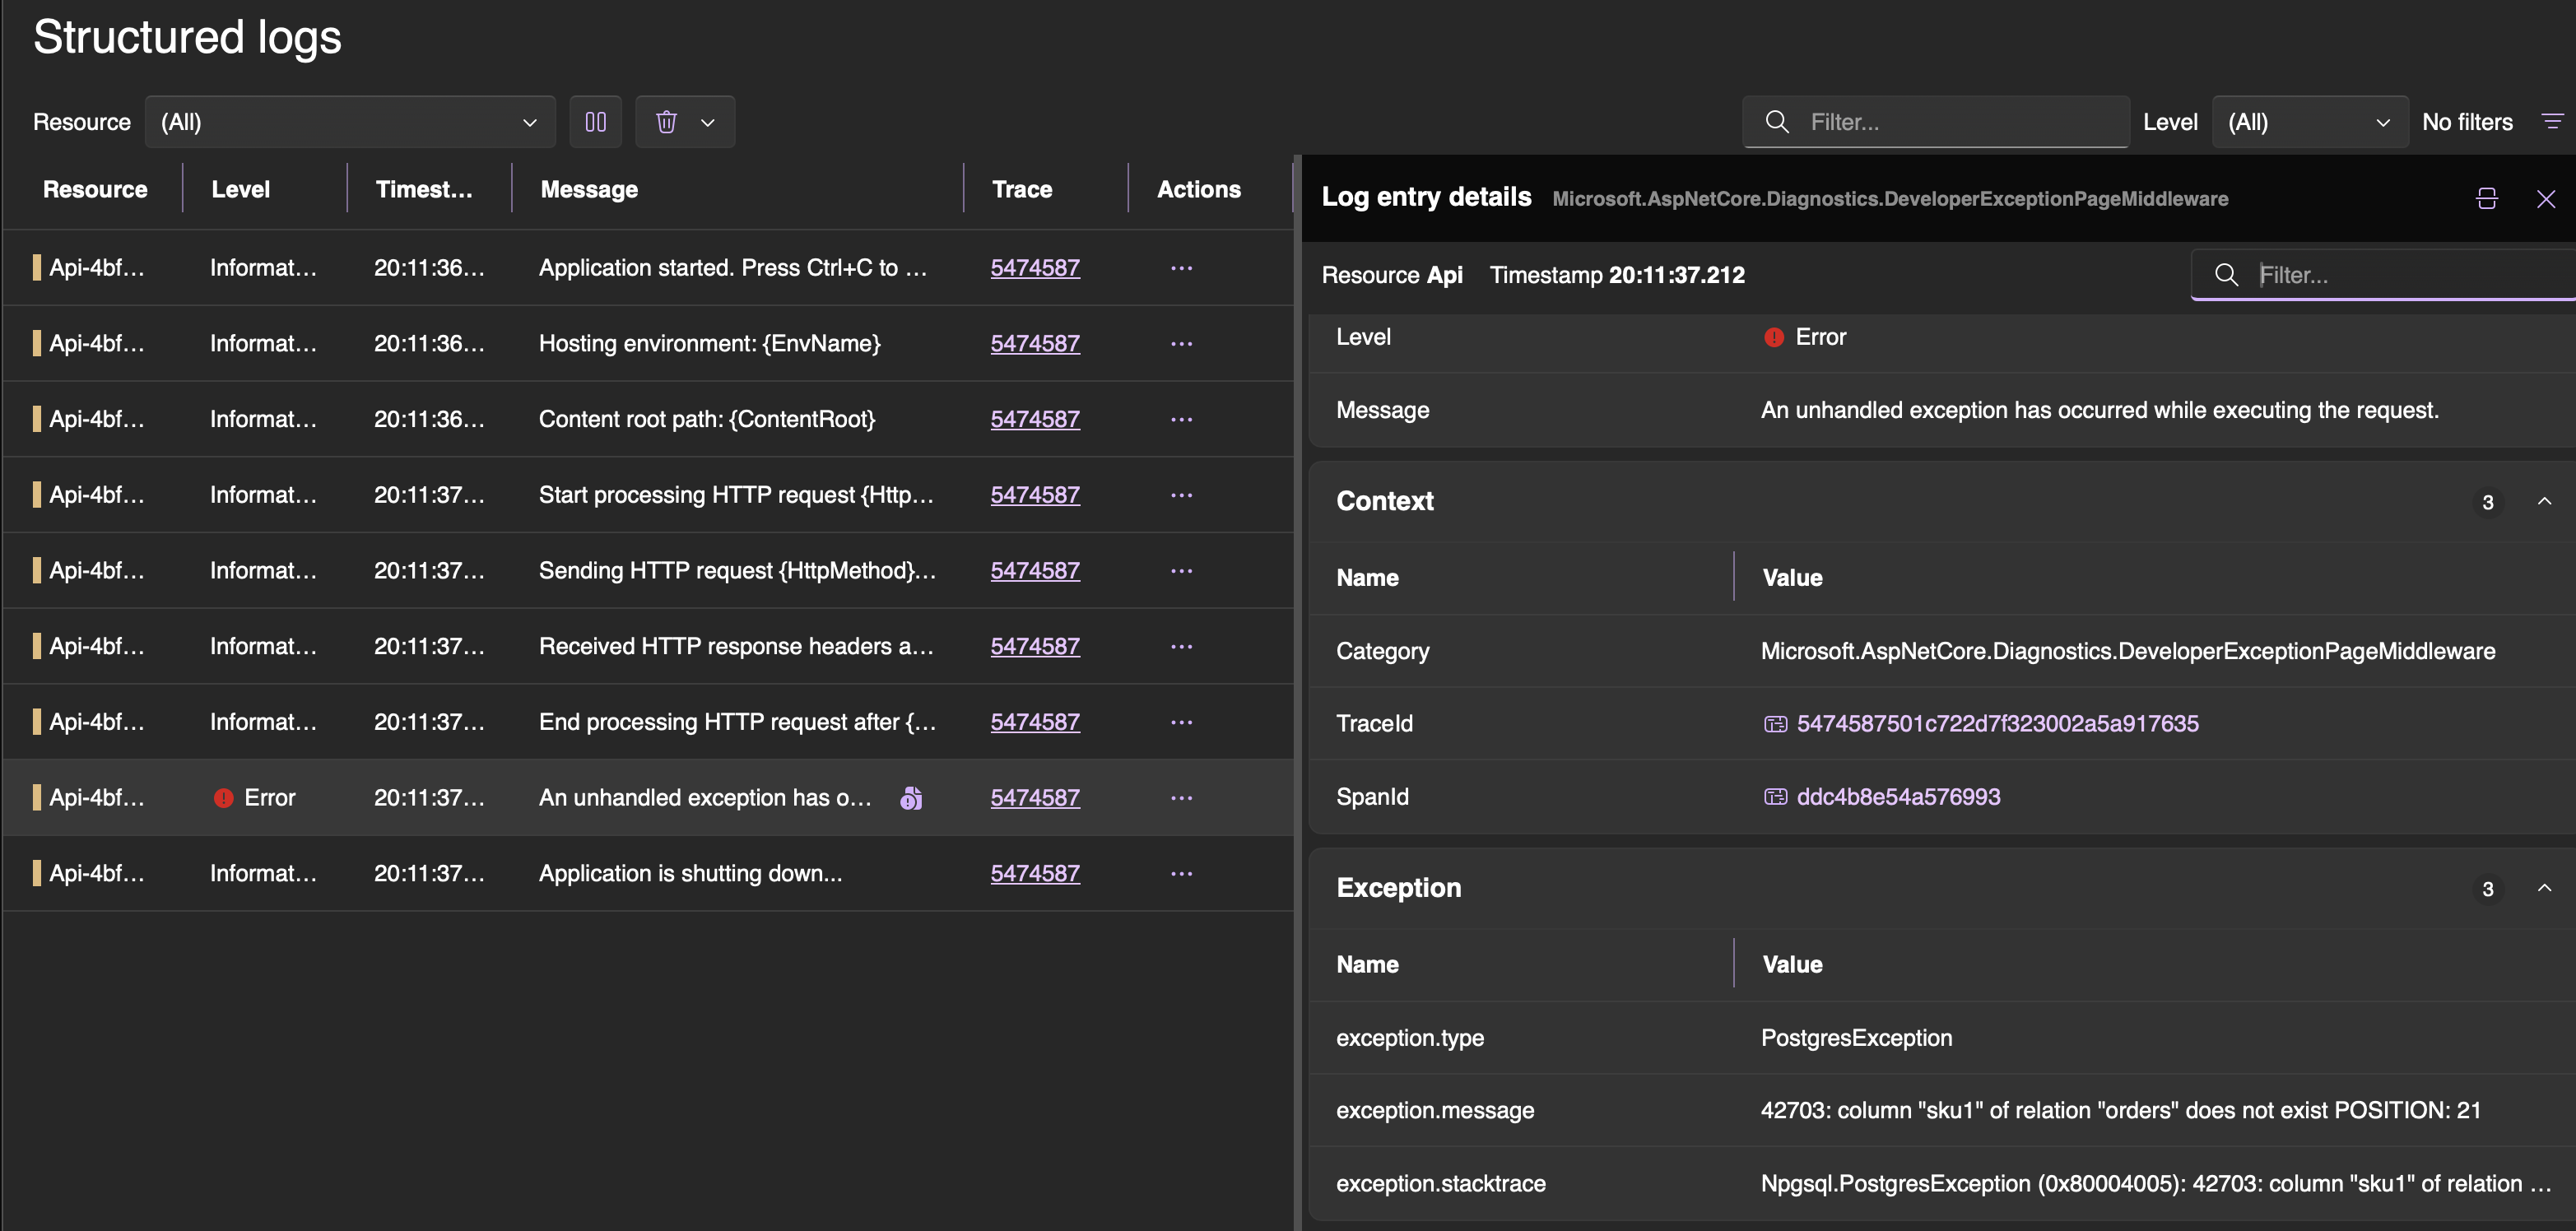
This turns root cause analysis from guesswork into a visual exercise. Instead of adding Console.WriteLine and re-running, you just read the trace.
Wrapping up
Let’s step back and look at what we’ve built:
- TUnit as the testing framework — parallel by default, clean lifecycle hooks, shared fixtures via
ClassDataSource - Testcontainers for real infrastructure — Postgres, Kafka, WireMock, all running in Docker alongside our tests
- OpenTelemetry for context propagation — each test gets its own trace, which isolates WireMock stubs and enables parallel execution without flakiness
- Aspire Dashboard for observability — full distributed traces, structured logs, and metrics from both the test and the API, visible in a single UI
All of this runs with a single click — no docker-compose, no manual setup, no Postman. You write a test, you run it, and you can debug the entire distributed flow from your IDE.
Functional tests built this way are not just tests — they’re living documentation, debugging tools, QA collaboration points, and API usage examples all rolled into one. And in a world where AI can rewrite your internals at any moment, they might be the most durable investment you can make in your codebase.
Many implementation details required for a hassle-free experience with functional tests were omitted to keep this post shorter and simpler. A fully functioning example with all the rough edges handled can be found in this repo. 🚀
Comments